 Search the WinSPC Knowledgebase Search the WinSPC Knowledgebase |
 Browse by Category Browse by Category |
|
|
|
|
|
| What is the difference between a base chart type and a default chart type? |
|
Thank you for rating this answer.
|
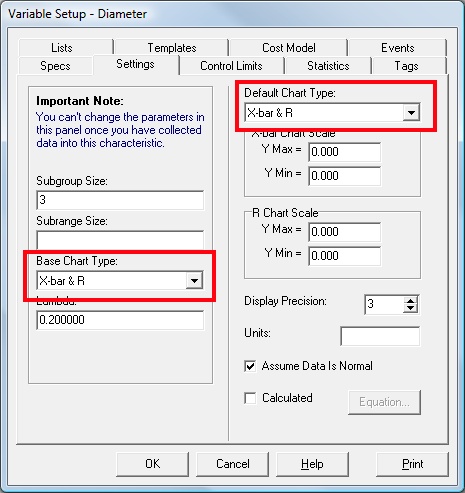
Both the base chart type and default chart type are configured in the "Settings" tab of the variable advanced properties window (accessed under the "Parts/Processes" tree). Attribute characteristics do not have a base chart type (but they do have a default chart type).

The "Base Chart Type" option controls the chart used by WinSPC for the purpose of calculating control limits, statistics, and subgroup level control test violations. For example, if "X-bar & R" is selected, WinSPC will use R-bar/d2 in the calculation for sigma, while if "X-bar & S" is selected, WinSPC will use S-bar/c4 (assuming that "Est. based on Process Variables" is selected in the "Control Limits" tab). The following base chart types are available (dependant on configured subgroup size):
- Subgroup size greater than 1
- X-bar & R
- X-bar & S
- Median & R
- Subgroup size equal to 1
The "Default Chart Type" option controls what type of chart is visible by default when a chart is displayed for this characteristic in Data Collection, the Legacy Query Tool, or Plant Monitor. When viewing a chart, the user has the option of changing the chart type by right clicking on the chart and choosing a different chart type (assuming they have the permission to do so). The following default chart types are available (dependant on the configured subgroup size):
- Subgroup size greater than 1
- X-bar & R
- X-bar & S
- Median & R
- Median(r) & R
- Pre-Control
- S2
- Tabular Cusum
- Subgroup size equal to 1
Additional chart types are available during data collection by modifying the options in the "Chart Layout" tab of the Collection Plan properties, or by right clicking on the chart as described above.
|
| Attachments |
|
No attachments were found.
|
| Visitor Comments |
|
No visitor comments posted. Post a comment
|