 Search the WinSPC Knowledgebase Search the WinSPC Knowledgebase |
 Browse by Category Browse by Category |
|
|
|
|
|
| How do I set a default Chart Scheme for the Variable Analyzer, Attribute Analyzer, Dashboards and Reports for a User or User Group? |
|
Thank you for rating this answer.
|
Introduction:
 The charting component of WinSPC's Variable Analyzer, Attribute Analyzer, Dashboards and Report Designer are highly configurable. The configurations concerning colors and visual elements are controlled by Chart Schemes*. If there is a particular chart configuration you like to often use (for example, having the control limits and specification limits always be visible), you may want to set a default Chart Scheme for a User or set of Users within a User Group. By setting a default Chart Scheme, each time a user displays a chart using the analysis or reporting tools, the chart will use the configured default Chart Scheme. The charting component of WinSPC's Variable Analyzer, Attribute Analyzer, Dashboards and Report Designer are highly configurable. The configurations concerning colors and visual elements are controlled by Chart Schemes*. If there is a particular chart configuration you like to often use (for example, having the control limits and specification limits always be visible), you may want to set a default Chart Scheme for a User or set of Users within a User Group. By setting a default Chart Scheme, each time a user displays a chart using the analysis or reporting tools, the chart will use the configured default Chart Scheme.
There are 2 different areas within WinSPC that you can use Chart Schemes:
- Analysis - This includes the charts and histograms within Variable and/or Attribute Analyzers.
- Printed Reports - This includes any new (additional) charts added to any Report Template.
Procedure:
To set a default Chart Scheme on a user or user group:
- Log in as a user with Administrative privileges.
- Select the 'Users' node from the Tree.
- Right click on either the User or User Group that you would like to set a default color scheme and select 'Properties'.
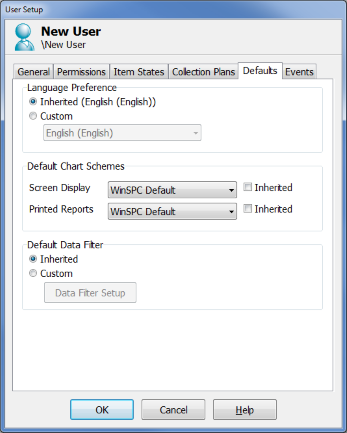
- Click on the 'Defaults' tab.
- If you want the user to inherit the default Chart Scheme for either the Screen Display or the Printed Reports from the parent User Group, check the 'Inherited' option in the 'Default Chart Schemes' area.
- If you want to manually select the default Chart Scheme this this User or User Group, under the 'Default Chart Schemes' area of the 'Defaults' tab, select the desired Chart Scheme from the drop-down box.
- Click 'OK'.
Also, in WinSPC 9 and above, Dashboards using the (Default) scheme option in their Chart components will use the Screen Display default set in step 5.
Tips:
You will likely want a color scheme that has higher contrast and a white background for your Printed Report Chart Color Scheme. This will allow for printouts that will use less ink/toner and have higher black and white contrast. *Chart Schemes were previously referred to as Chart Color Schemes in WinSPC 8. If you would like to setup your own new Chart Schemes, you can do so by selecting "Tools" > "Chart Schemes" from the drop down menu at the top of the Administrator window.
NOTE: Dashboards and Attribute Analyzer were introduced in WinSPC 9.
|
| Attachments |
|
No attachments were found.
|
| Visitor Comments |
|
No visitor comments posted. Post a comment
|