 Search the WinSPC Knowledgebase Search the WinSPC Knowledgebase |
 Browse by Category Browse by Category |
|
|
|
|
|
| Can I zoom in on a chart? |
|
Article Details
Last Updated
16th of July, 2018
Applies to
WinSPC 9.0
|
|
Thank you for rating this answer.
|
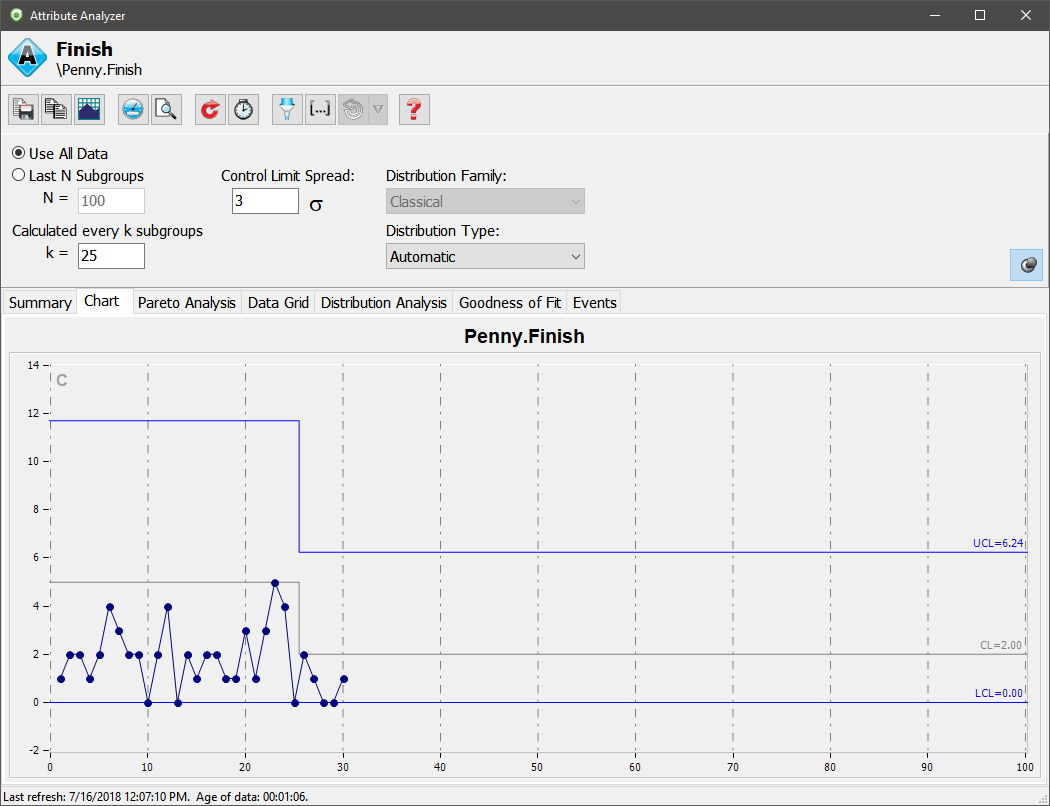
In the Variable Analyzer and Attribute Analyzer, you have the ability to zoom in on the chart. The ability to zoom is convenient especially when there are numerous data samples which may cluster the data on the chart making it almost unreadable. There are several different zoom options, depending on choice of mouse clicks and key strokes. The following is a description of the different zooming options:
- Log in to WinSPC as the Admin user or a user that has Administration permissions to the Variable Analyzer and/or Attribute Analyzer.
- In the Administrator window, expand the Collection Plans node in the Tree pane.

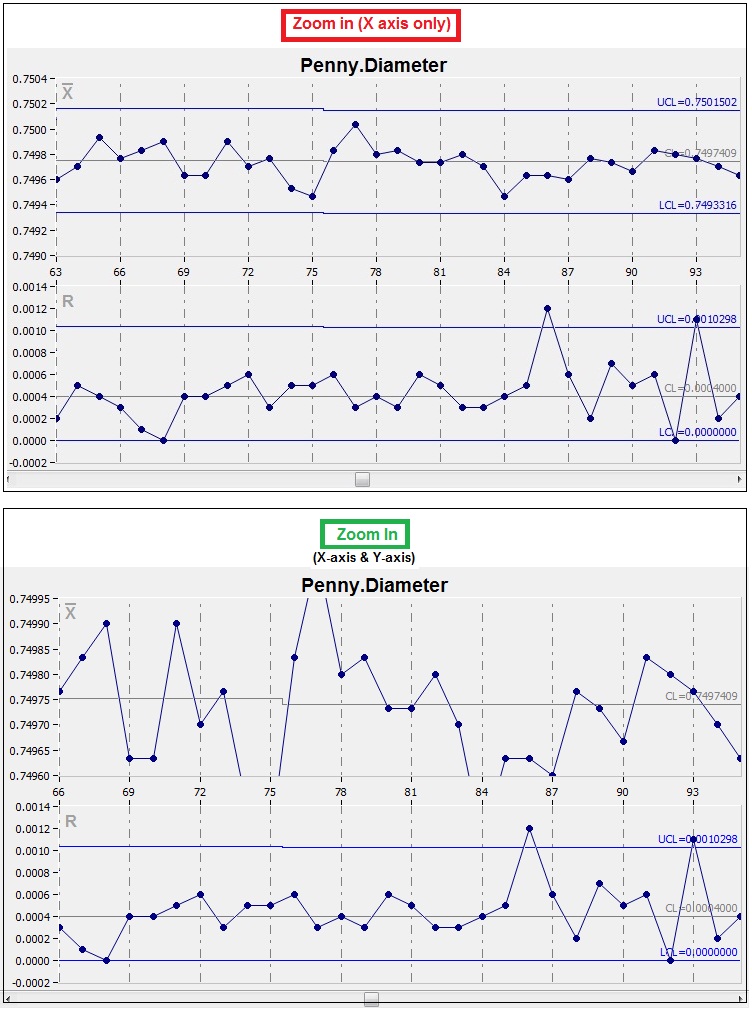
- Zoom In (X-axis only): This will zoom in on a section of the chart along the width (X-axis), but will not affect the height (Y-axis). This means you will still see the highest and lowest points, in the zoomed in section, on the chart.
o Using the popup menu:
1. Right-click and hold inside the chart.
2. Drag to the right, selecting the area to be enlarged,
and release.
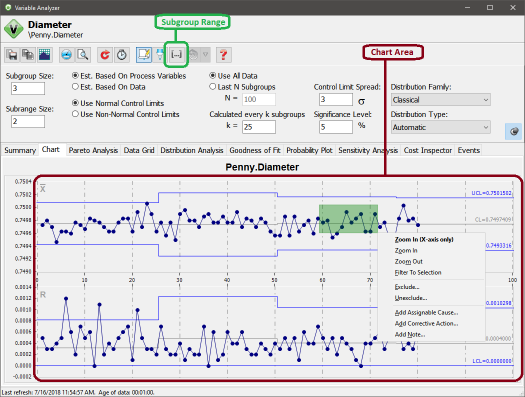
3. From the popup menu, select Zoom In (X-axis only)
see Figure 1.
o Fast zoom:
1. Left-click and hold inside the chart.
2. Drag to the right, selecting the area to be enlarged,
and release.
- Zoom In: This will zoom in on a section of the chart in both the width and height (X-axis and Y-axis). This means that points could possibly fall outside of the view on the chart.
o Using the popup menu:
1. Press and hold the Ctrl key down on the keyboard.
2. Right-click and hold inside the chart.
3. Drag to the right, selecting the area to be
enlarged, and release.
4. From the popup menu, select Zoom In.
o Fast zoom:
1. Press and hold the Ctrl key down on the keyboard.
2. Left-click and hold inside any viewable chart.
3. Drag to the right, selecting the area to be enlarged,
and release.
- Zoom Out: This will zoom out to show you the entire chart.
o Using the popup menu:
1. Right-click and hold inside the chart.
2. Drag to the left any distance and release.
3. From the popup menu, select Zoom Out.
o Fast zoom:
1. Left-click (or right-click) and hold inside the chart.
2. Drag to the left any distance and release.
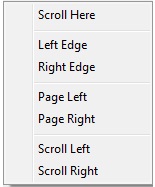
- Scrolling through chart data while zoomed-in: This will scroll the chart left or right. Also you can page left and right, and move to the left or right edge.
o Using the popup menu:
1. Right-click on the scrollbar, located at the bottom of the
window.
2. Select from the following options:

o Fast zoom:
1. Left-click and hold the scrollbar handle, located at the bottom of the window, and drag to the left or right.
- Filter To Selection: This will let you select a range of subgroups of data to view, and have statistical calculation preformed on just the selected range of subgroups.
o Using the popup menu:
1. Right-click and hold inside the chart.
2. Drag to the right, selecting the area to be filtered, and release.
3. From the popup menu, select Filter To Selection.
o Manual entry range:
1. Left-click on the icon labeled Subgroup Range in the toolbar […].
2. Enter the desired From Subgroup and To Subgroup range.
3. Click on the OK button.
o De-activate Subgroup Range filter.
1. Left-click on the icon labeled Subgroup Range in the toolbar […].

|
| Attachments |
|
No attachments were found.
|
| Visitor Comments |
|
No visitor comments posted. Post a comment
|